

Holistic Management asks us to make decisions with the whole in mind: the people, the money and the land. In practice that whole is usually scattered across spreadsheets, paper maps, photo folders and the memory of whoever walked the paddocks last. StockMan, our platform at stockman.goodall-maps.com, brings it together.
StockMan is organised around three tabs, Work, Capital and Land, and every farm or company starts from its holistic context.
Start from the holistic context
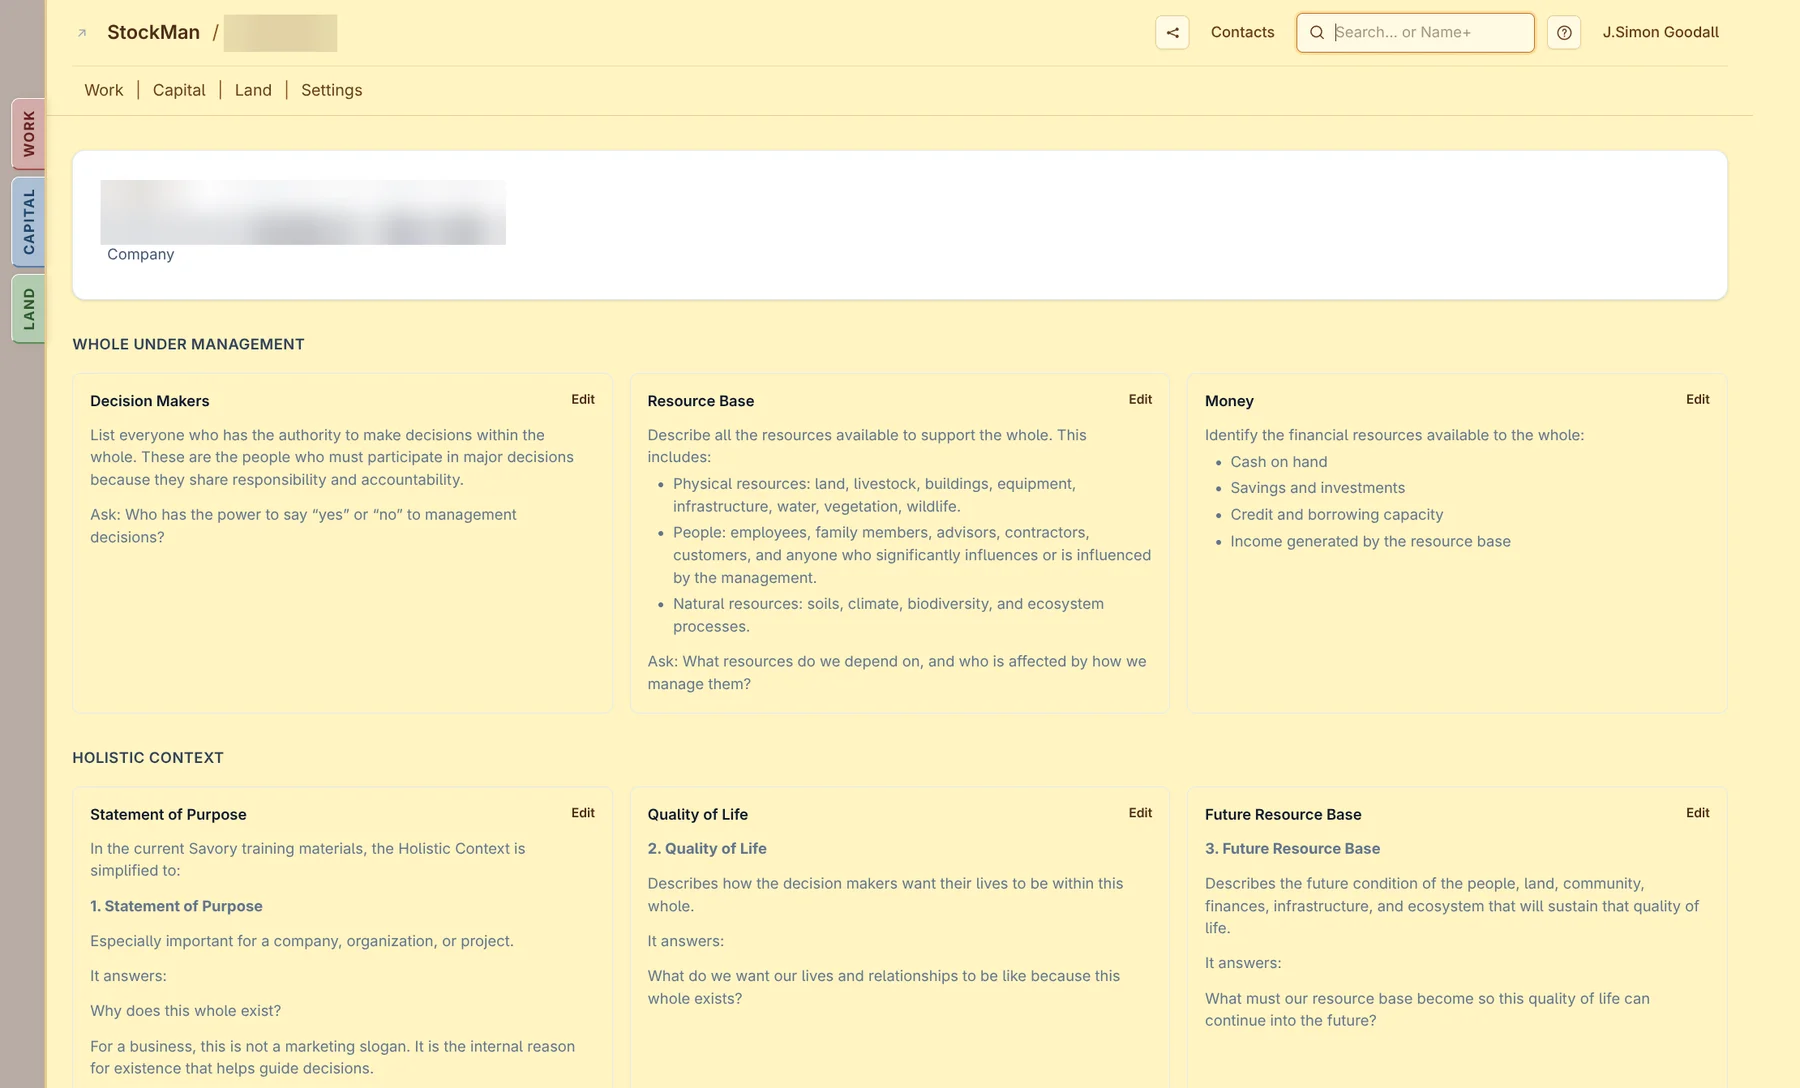
Each whole begins with a page that follows the Savory training materials. First, the whole under management: the decision makers, the resource base (land, livestock, buildings, people, soils, climate, biodiversity) and the money available. Then the holistic context itself: the statement of purpose, the quality of life the decision makers want, and the future resource base that will sustain it. Each card carries the guiding questions, so the team can fill it in together.
Land: the farm map
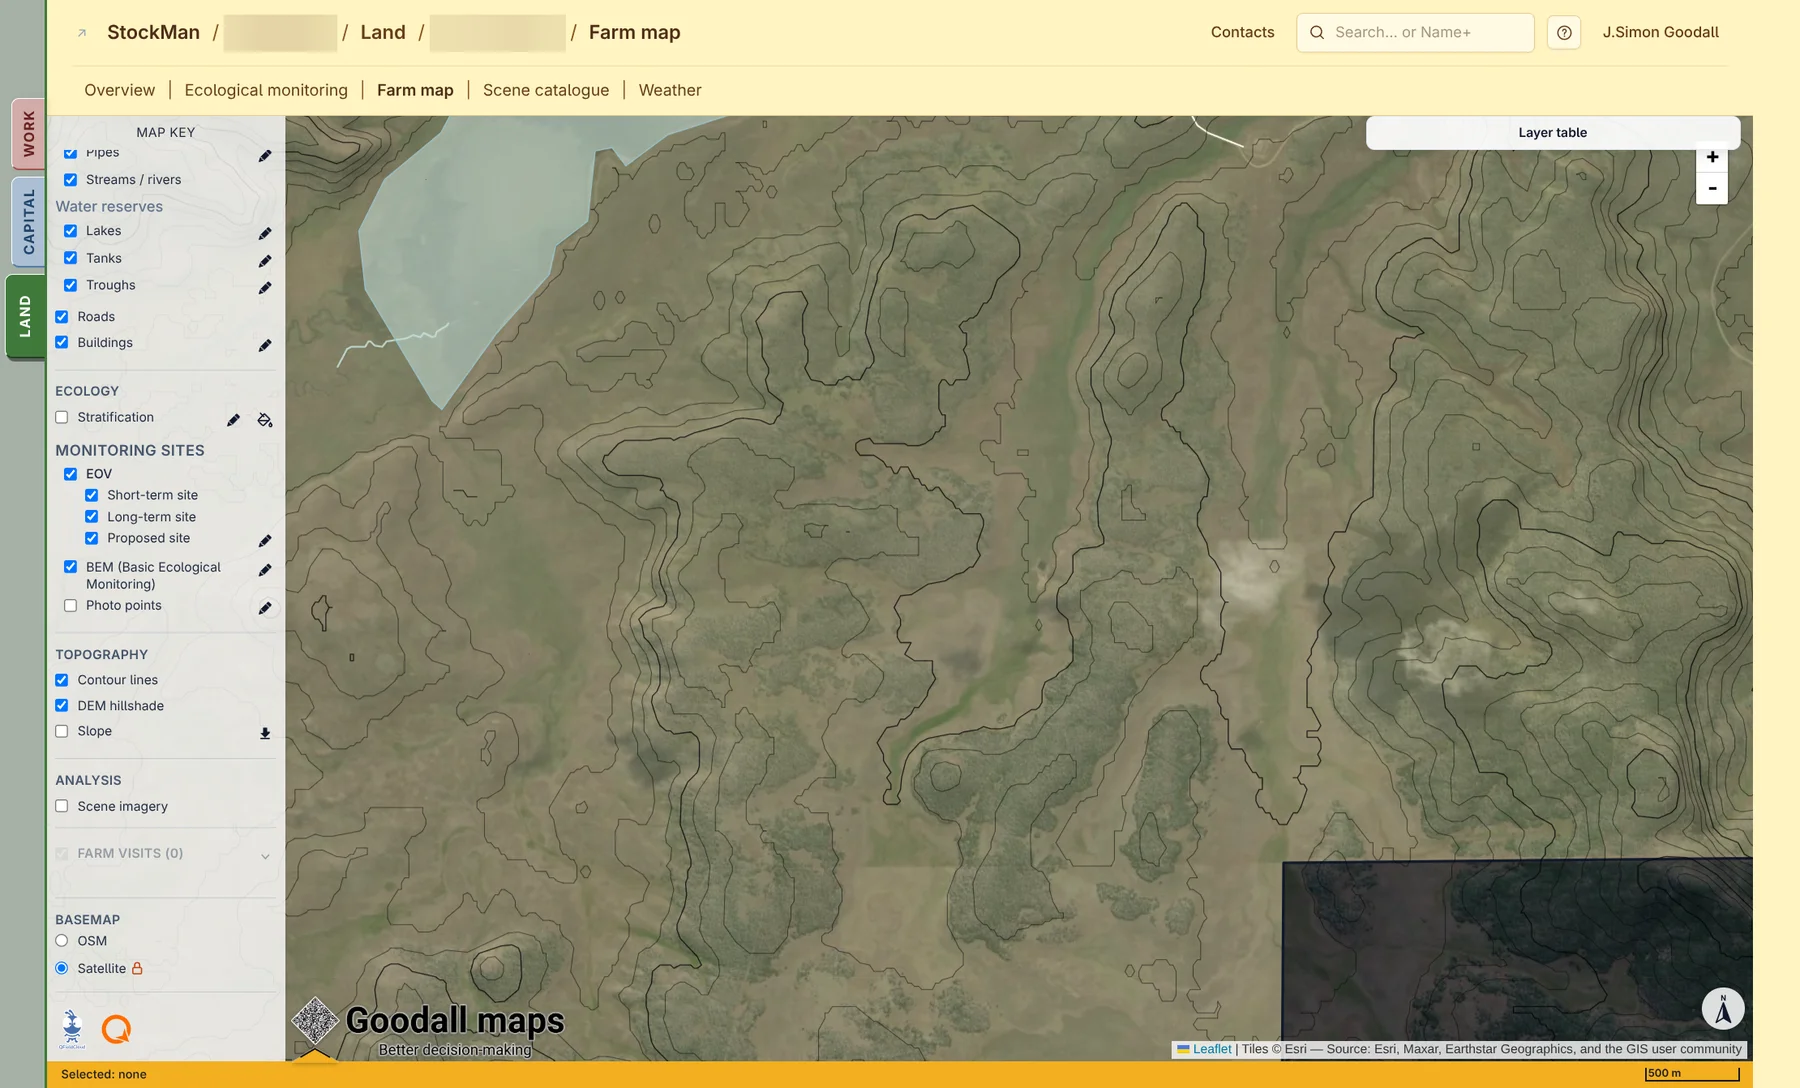
The farm map puts everything about the land on one map: water (pipes, streams, lakes, tanks and troughs), roads and buildings, ecological stratification, and the monitoring sites, both EOV (short-term, long-term and proposed sites) and Basic Ecological Monitoring with its photo points. Topography comes with contour lines, hillshade and slope, over a satellite or OpenStreetMap basemap. The same layers go out to the field in QGIS and QField, so what is mapped on a farm visit comes straight back.
See the land change from space
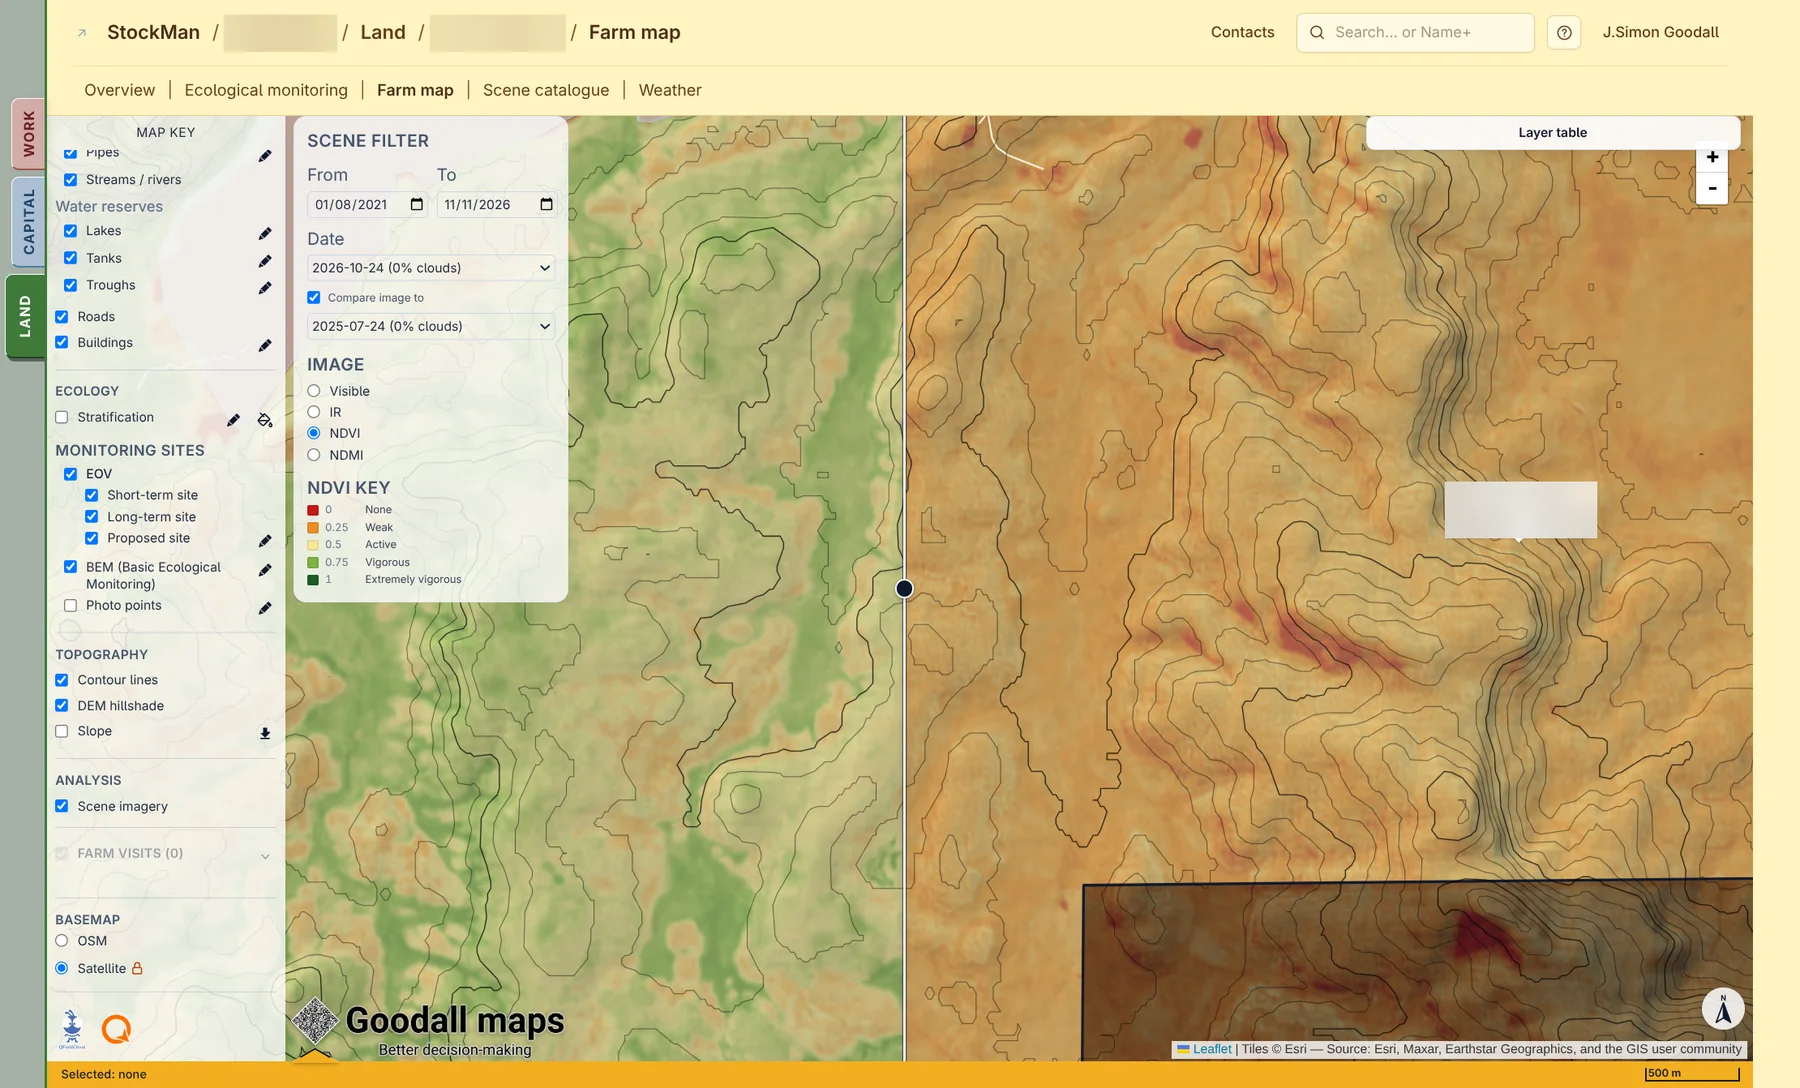
The scene catalogue watches every property with Sentinel-2 satellite imagery. It finds each new image over the farm outline, estimates the cloud cover over the farm itself, and prepares visible, infrared, NDVI and NDMI views. On the farm map you can pick any date, or compare two dates with a slider. Below, NDVI from a clear day in spring 2026 sits next to the dry winter of 2025: the same paddocks, plant growth from none (red) to extremely vigorous (dark green).
Ecological monitoring, the weather and the farm visits (with GPS tracks, notes and documents) sit next to the map, in the same place.
Capital: the register and the money
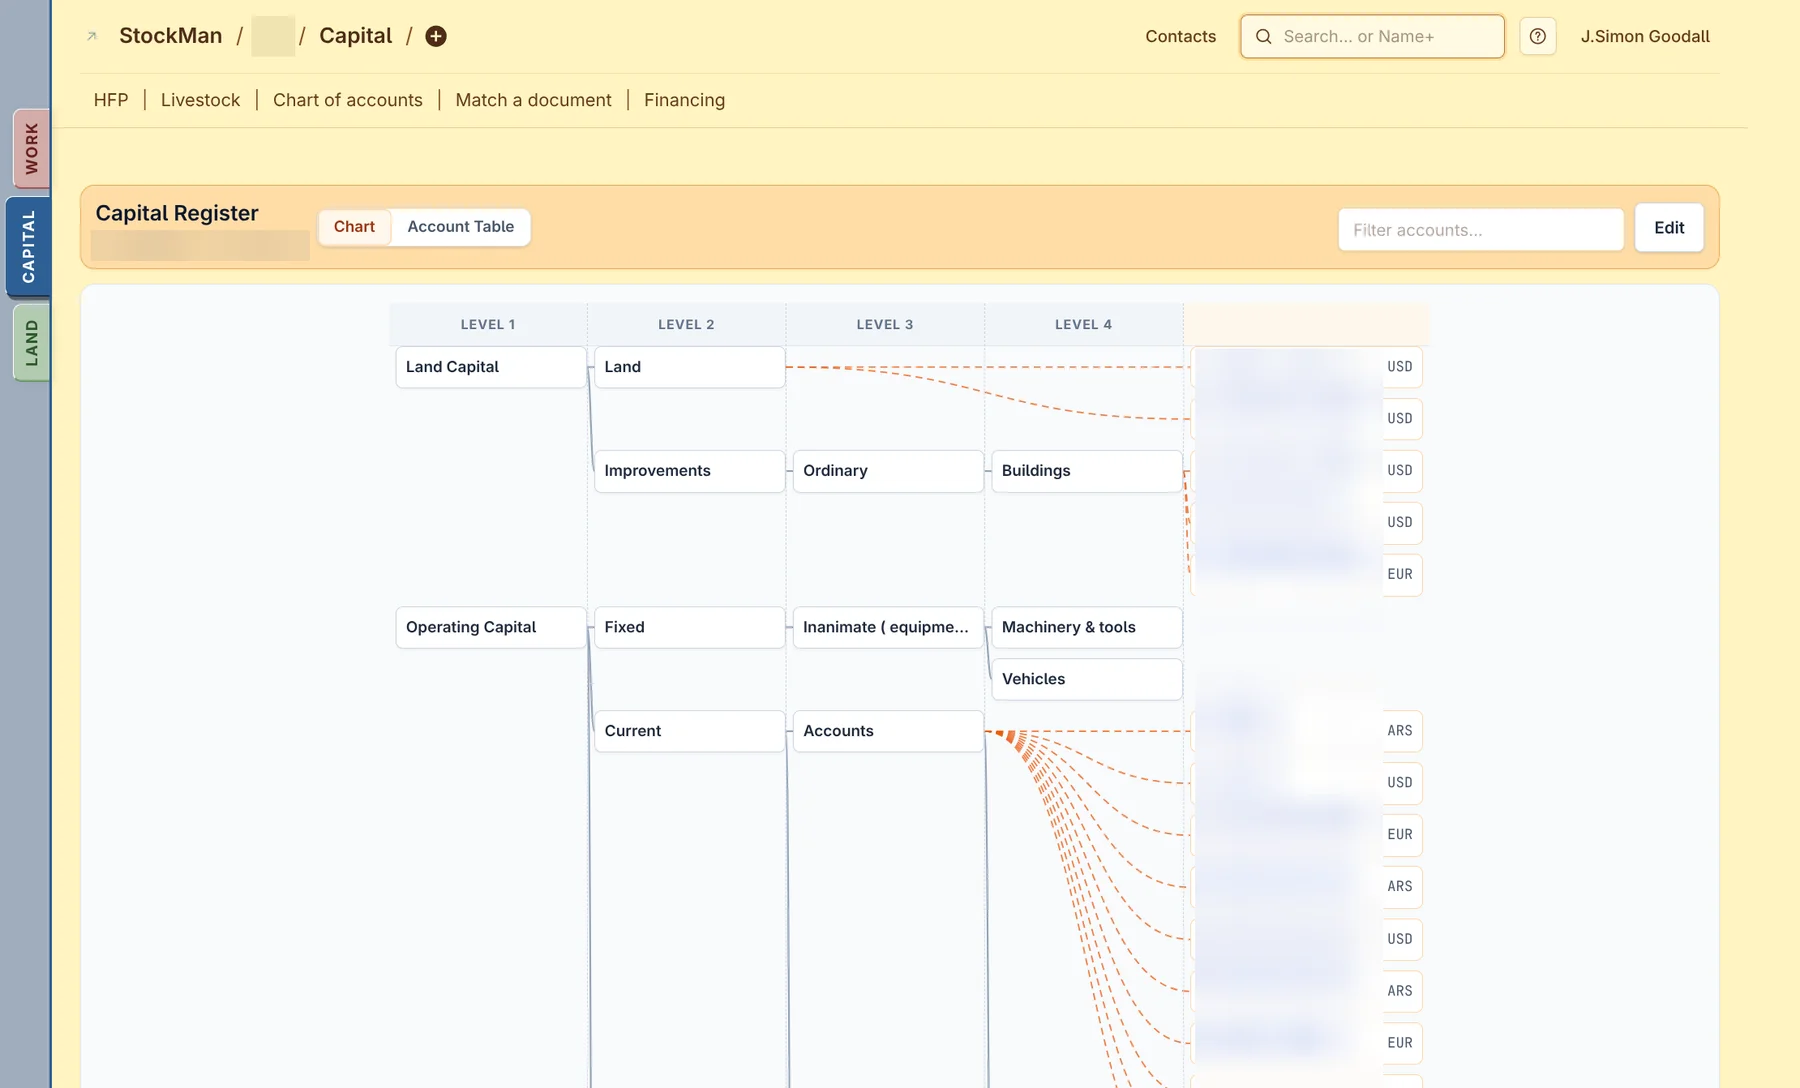
The Capital tab holds the capital register: land and improvements, fixed and current operating capital, down to every property and bank account, in any currency. Next to it are the chart of accounts, holistic financial planning (HFP), livestock, financing, and a tool to match receipts and documents to the right account.
Work
The Work tab brings the calendar together: planned and past farm visits and events, for everyone working on the farm.
Would you like to try it?
StockMan is what we use with the farms we work with, and each farm only sees its own data. If you would like to see it on your own land, write to us.